Fish Weight: How Plump is that Fish?
By Dave Willis and Bob Lusk
Fishery biologists have used quite a few different condition factors over the years.
One of the tools used by a professional fishery biologist is an assessment of the plumpness of a fish. In other words, how much does that fish weigh compared to its length? Fish weight as a function of fish length provides biologists with what are known as condition factors.
Why in the world do we measure fish condition?
If fish are too thin or too plump for their length, it should mean something to a biologist or pond owner. Too thin: could the population density be high and food is limiting—too many mouths and not enough cafeterias? That is common for largemouth bass in ponds. Maybe the environmental conditions are not appropriate for that fish species and they are not doing too well? Remember, we preach how important habitat is to a species. Not only is habitat important to the species, it’s important to the different size classes of each species. Habitat is a key component of environment. If your fish aren’t thriving, environmental issues may play a role.
Too plump: food apparently is abundant, so could we increase population density, perhaps through a stocking program or habitat improvement? Maybe we should stock an additional predator species to use some of the available prey that obviously is present in that pond? When the cafeteria has too much food, and the big fish look like footballs with fins, we can have a different issue. That’s when reproduction issues occur, for example. Imagine the survival rates of baby fish when a pond’s fishery is dominated by the food chain, especially sunfish. They’ll literally eat a nest out of house and home.
Fishery biologists have used quite a few different condition factors over the years. The most commonly used tool these days is relative weight (Wr). As a pond owner and manager of your own unique fish population, you need to know how to calculate relative weight of your fish for comparison to years of historical scientific data. We will concentrate on this particular index because of its ease of use and interpretation.
Relative weight was first developed by Dr. Richard Anderson back in the late 1970s. Yes, that’s the same Dr. Richard Anderson who spoke at Pond Boss I. It is calculated as follows.
Wr = [W / Ws] X 100
Where W is the actual weight of the fish being measured and Ws is the standard weight for a fish of that length. The standard weight equations are actually the key to the success with this technique, and biologists worked hard to develop reliable standards. In the pages to follow, we will provide standard weight tables in inches and pounds for your use. Fishery biologists often use millimeters and grams for their measurements because of increased accuracy and precision, but the inches-pounds tables will work well to help you assess the fish in your ponds.
We have seen Wr values that range from the upper 50s to the 160s for a variety of fish species. Fish in the upper 50s are so thin they are barely alive. Those at 140 or above look like plump footballs. Most biologists target Wr values of perhaps 90-100 as being acceptable. Please note that a Wr value of 100 is NOT an average. It actually means that all across their range, and across all seasons, 25% of the largemouth bass will have a Wr value greater than 100, while 75% will be less than 100. So, a Wr value of 100 is an above-average target, generally speaking.
Sound complicated? It’s really not. That Wr value is simply a goal, that’s all. If your fish Wr is 100, you’re in good shape. If it’s 90, that’s normal.
Now, let’s try an example. Assume you caught a largemouth bass from your pond last September. The fish is 10.9 inches long and weighs 0.49 pounds. What is the Wr value for this fish?
Wr = [0.49 pounds / 0.643 pounds] X 100 = 76
Where did we get the 0.643 pounds for the Ws value? Go down the left-hand column in Table 1 until you get to 10 inches. Then, move to the right along that row until you get to the column labeled 0.9 inches—you should now read 0.643 pounds from the table for that fish of 10.9 inches. Now, let’s turn to an assessment of this largemouth bass. It’s September, which is usually a prey-rich time in most ponds. If your small bass has a Wr value of only 76, it is thin compared to largemouth bass across their range. So, we suspect your pond may be exhibiting a common condition of high-density, slow-growing bass, especially if quite a few of your bass look like this one.
Let’s try another largemouth bass example. Let’s say you caught a largemouth bass from your pond in late May that is 14.8 inches and weighs 1.48 pounds.
Wr = [1.48 pounds / 1.75 pounds] X 100 = 85
What is our assessment of the Wr for this largemouth bass? Be careful, we planted a trick question here. At first glance, you might think a Wr of 85 simply means a thin fish and you might be thinking high population abundance again. However, assume your fish is a female and just finished spawning. Does that change your assessment? It is possible for a healthy female to drop to 85 just after spawning. However, by September, we’d expect a healthy, fast-growing female to be 100 or above again. If she still weighed 85 in September, then we’d be back to thinking the prey supply was too low for the number of bass in the pond.
Table 1. Standard weight (Ws) table for largemouth bass in inches and pounds (based on the Ws equation by Jeff Henson). The “whole” inch group is in the left column; run to the right to find the appropriate weight in pounds by 0.1 inch groups. For example, the Ws for a 6.5-inch largemouth bass would be 0.118 pounds; for a 6.6-inch bass it would be 0.125 pounds.
| Length (in) | 0.0 | 0.1 | 0.2 | 0.3 | 0.4 | 0.5 | 0.6 | 0.7 | 0.8 | 0.9 |
| 6 | 0.091 | 0.096 | 0.102 | 0.107 | 0.113 | 0.118 | 0.125 | 0.131 | 0.137 | 0.144 |
| 7 | 0.151 | 0.158 | 0.166 | 0.173 | 0.181 | 0.189 | 0.198 | 0.206 | 0.215 | 0.224 |
| 8 | 0.234 | 0.243 | 0.253 | 0.264 | 0.274 | 0.285 | 0.296 | 0.308 | 0.319 | 0.331 |
| 9 | 0.344 | 0.356 | 0.369 | 0.383 | 0.396 | 0.410 | 0.425 | 0.439 | 0.454 | 0.470 |
| 10 | 0.485 | 0.501 | 0.518 | 0.535 | 0.552 | 0.569 | 0.587 | 0.606 | 0.624 | 0.643 |
| 11 | 0.663 | 0.683 | 0.703 | 0.724 | 0.745 | 0.767 | 0.789 | 0.811 | 0.834 | 0.858 |
| 12 | 0.88 | 0.91 | 0.93 | 0.96 | 0.98 | 1.01 | 1.03 | 1.06 | 1.09 | 1.12 |
| 13 | 1.15 | 1.17 | 1.20 | 1.23 | 1.26 | 1.30 | 1.33 | 1.36 | 1.39 | 1.43 |
| 14 | 1.46 | 1.49 | 1.53 | 1.56 | 1.60 | 1.64 | 1.67 | 1.71 | 1.75 | 1.79 |
| 15 | 1.83 | 1.87 | 1.91 | 1.95 | 1.99 | 2.04 | 2.08 | 2.12 | 2.17 | 2.21 |
| 16 | 2.26 | 2.31 | 2.35 | 2.40 | 2.45 | 2.50 | 2.55 | 2.60 | 2.65 | 2.70 |
| 17 | 2.76 | 2.81 | 2.86 | 2.92 | 2.97 | 3.03 | 3.09 | 3.14 | 3.20 | 3.26 |
| 18 | 3.32 | 3.38 | 3.45 | 3.51 | 3.57 | 3.63 | 3.70 | 3.76 | 3.83 | 3.90 |
| 19 | 3.97 | 4.03 | 4.10 | 4.17 | 4.25 | 4.32 | 4.39 | 4.46 | 4.54 | 4.61 |
| 20 | 4.69 | 4.77 | 4.85 | 4.93 | 5.01 | 5.09 | 5.17 | 5.25 | 5.33 | 5.42 |
| 21 | 5.50 | 5.59 | 5.68 | 5.76 | 5.85 | 5.94 | 6.03 | 6.13 | 6.22 | 6.31 |
| 22 | 6.41 | 6.50 | 6.60 | 6.70 | 6.80 | 6.90 | 7.00 | 7.10 | 7.20 | 7.31 |
| 23 | 7.41 | 7.52 | 7.63 | 7.73 | 7.84 | 7.95 | 8.06 | 8.18 | 8.29 | 8.40 |
| 24 | 8.52 | 8.64 | 8.75 | 8.87 | 8.99 | 9.11 | 9.24 | 9.36 | 9.49 | 9.61 |
How about bluegill, you might ask? Bluegills happen to be a common prey species for largemouth bass and a popular sport fish in its own right. It’s late September, you really should be back in school, and you just caught an 8.0 inch bluegill that weighed 0.6 pounds.
Wr = [0.6 pounds / 0.42 pounds] X 100 = 143
Where did we get the Ws value of 0.42 pounds? Look down the left-hand column in Table 2 and find 8 inches, move right one column to the 0.0 inch column, and find 0.42 pounds. What about an assessment for this fish? You have just caught a very nice, plump bluegill with a Wr value of 143. Both of us actually see such high values quite commonly. This high value means there is plenty of food per individual bluegill. Maybe you have a high density of small largemouth bass that really thin the numbers of small bluegills; surviving bluegill have plenty of food and grow quickly to a large size. Maybe another predator is limiting bluegill abundance. Maybe you are feeding the fish? Are you starting to get the hang of this assessment stuff?
Table 2. Standard weight (Ws) table for bluegill in inches and pounds (based on the Ws equation by Phil Hillman). The “whole” inch group is in the left column; run to the right to find the appropriate weight in pounds by 0.1 inch groups. For example, the Ws for a 3.5-inch bluegill would be 0.027 pounds; for an 11.0-inch bluegill it would be 1.209 pounds.
| Length (in) | 0.0 | 0.1 | 0.2 | 0.3 | 0.4 | 0.5 | 0.6 | 0.7 | 0.8 | 0.9 |
| 3 | 0.016 | 0.018 | 0.020 | 0.022 | 0.025 | 0.027 | 0.030 | 0.033 | 0.036 | 0.039 |
| 4 | 0.042 | 0.046 | 0.050 | 0.054 | 0.058 | 0.062 | 0.067 | 0.072 | 0.077 | 0.083 |
| 5 | 0.088 | 0.094 | 0.101 | 0.107 | 0.114 | 0.121 | 0.129 | 0.137 | 0.145 | 0.153 |
| 6 | 0.162 | 0.171 | 0.181 | 0.190 | 0.201 | 0.211 | 0.222 | 0.233 | 0.245 | 0.257 |
| 7 | 0.270 | 0.283 | 0.296 | 0.310 | 0.325 | 0.339 | 0.355 | 0.370 | 0.387 | 0.403 |
| 8 | 0.420 | 0.438 | 0.456 | 0.475 | 0.494 | 0.514 | 0.534 | 0.555 | 0.577 | 0.599 |
| 9 | 0.621 | 0.644 | 0.668 | 0.693 | 0.718 | 0.743 | 0.770 | 0.796 | 0.824 | 0.852 |
| 10 | 0.881 | 0.911 | 0.941 | 0.972 | 1.003 | 1.036 | 1.069 | 1.103 | 1.137 | 1.172 |
| 11 | 1.209 | 1.245 | 1.283 | 1.321 | 1.360 | 1.400 | 1.441 | 1.483 | 1.525 | 1.569 |
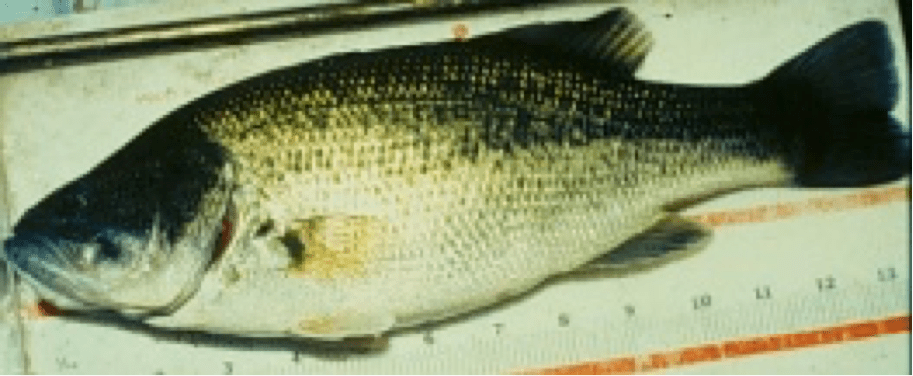
So, how well does this Wr technique work? Well, Wr is not some sensitive little tool. Differences in Wr can be seen visually. Below, take a look at the three largemouth bass photos. These fish were all relatively close in length. The photos were all taken by Dr. Anderson years ago. You can visually see the difference in plumpness for these three fish. Which one has a Wr of 120 (most plump)? Which has a value of 100? And which is only 80 (skinny)?


In closing, we want to repeat our warning that interpretation of Wr values is not always simple. Wr values can vary seasonally, especially before and after spawning seasons. Also, Wr values are a short-term measure of prey abundance. We have seen situations where a temporary, short-term prey supply is abundant, and fish gorge themselves and gain weight. However, if this is the only time of year that food is abundant, the fish may still be thin and slow-growing for the rest of the year. Nevertheless, Wr values are a very important tool in a pond managers arsenal!